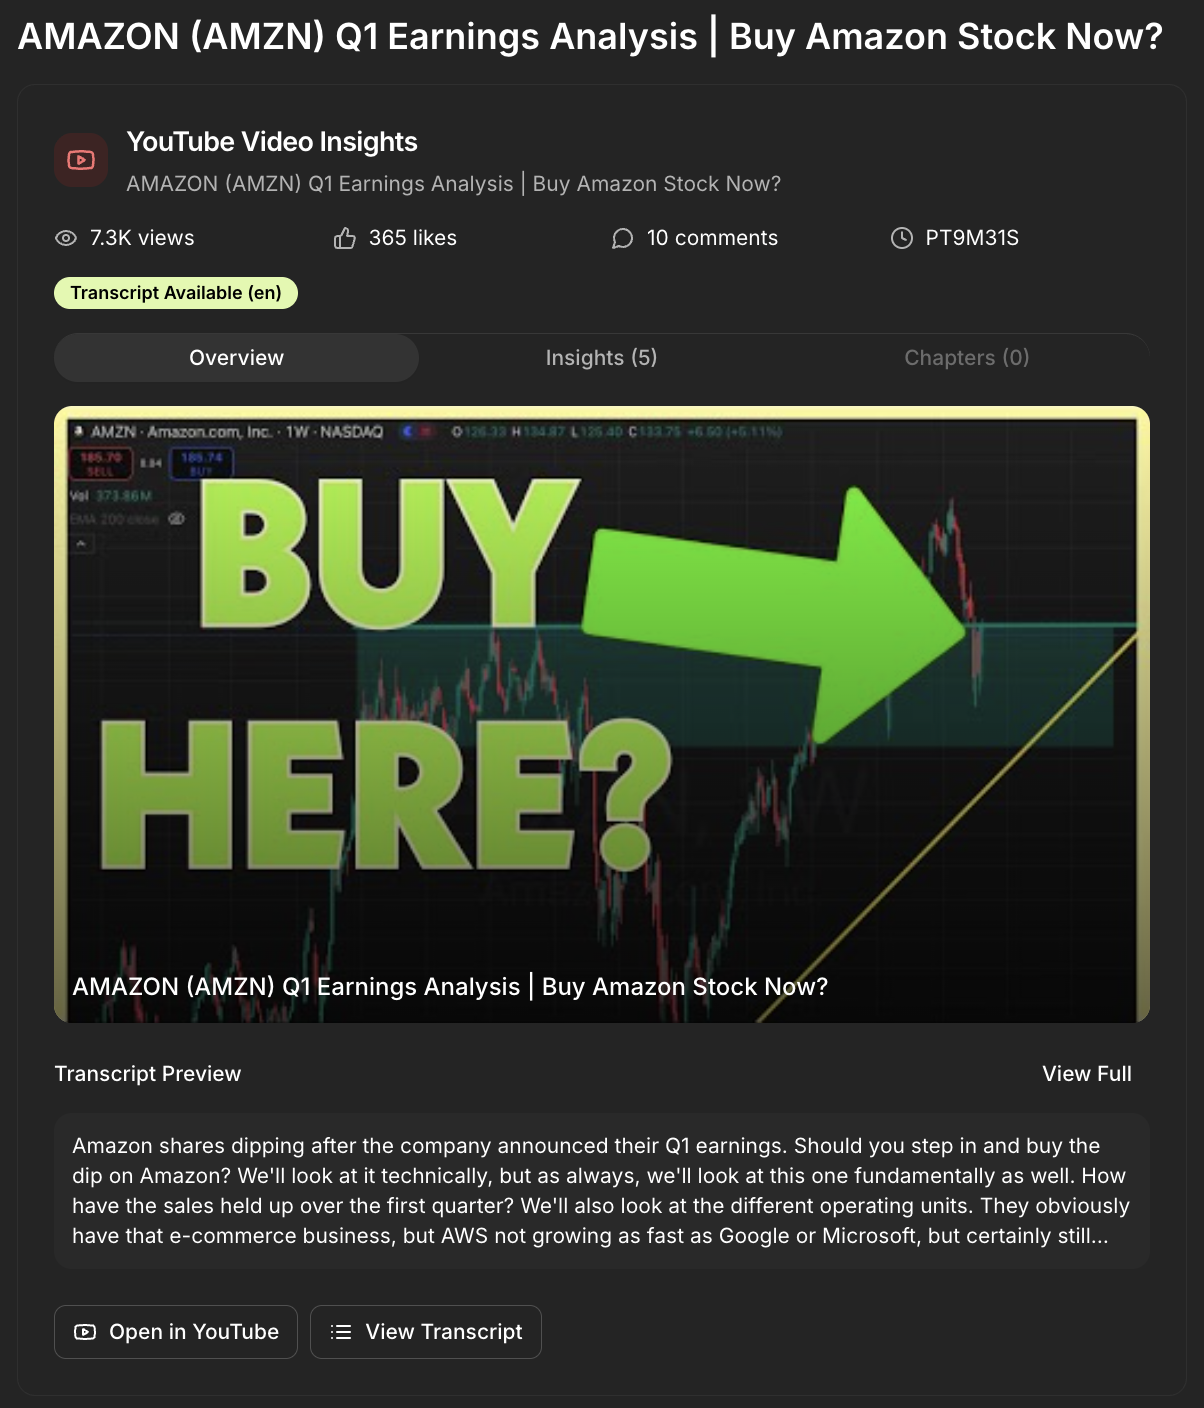
Source: The Investor Channel — "AMAZON (AMZN) Q1 Earnings Analysis | Buy Amazon Stock Now?" (May 2025). Transcript processed and analyzed through Helix AI's multi-modal semantic pipeline.
Key Takeaways
- Multi-modal semantic analysis turns unstructured video into structured reasoning data in seconds
- Knowledge graphs supply queryable context for finance, compliance, and AI agents—across systems
- RTL (Reasoning → Transform → Load) converts content streams into decision infrastructure
In this breakdown, we trace how nine minutes of market commentary become structured, queryable intelligence—ready for analysts, agents, and automation.
From Content to Capital
In Part I we showed how semantic analytics becomes a content blueprint. The natural pushback:
"Great for SEO. What can I do with it when money's on the line?"
Finance is where logic density is highest—and where reasoning compounds fastest.
When we fed the same engine nine minutes of Amazon's post-earnings commentary, it didn't just summarize—it reasoned. What emerged was a structured reflection of how Amazon thinks.
RTL—Reasoning, Transform, Load—is our analogue to ETL, built for reasoning instead of raw data.
Source: The Investor Channel | Video ID: gLbcN0-mGtI | Duration: 9:31 | Type: Post-earnings analysis (high density)
Result: not a transcript—an interactive knowledge graph built from dozens of semantic elements (entities, topics, phrases, domain terms) stitched into causal chains your analysts and agents can query. The entire process runs in seconds, maintaining around 90% confidence across topics.
Capturing the Logic Beneath the Talk
"A company's earnings narrative is a logic model spoken out loud. The job is to capture the logic—then compute on it."
Traditional tools count words, label sentiment, and miss the why. We model relationships: how CapEx influences AWS margins, how tariffs change inventory timing, how seller growth flows into ad monetization and operating income.
Once structured, the question becomes: what relationships drive this narrative?
Structural vs. Relationship Signal
| Structural Elements | Count |
|---|
| Topics (avg. ~90% confidence) | 7 |
| Entities across 4 categories | 14 |
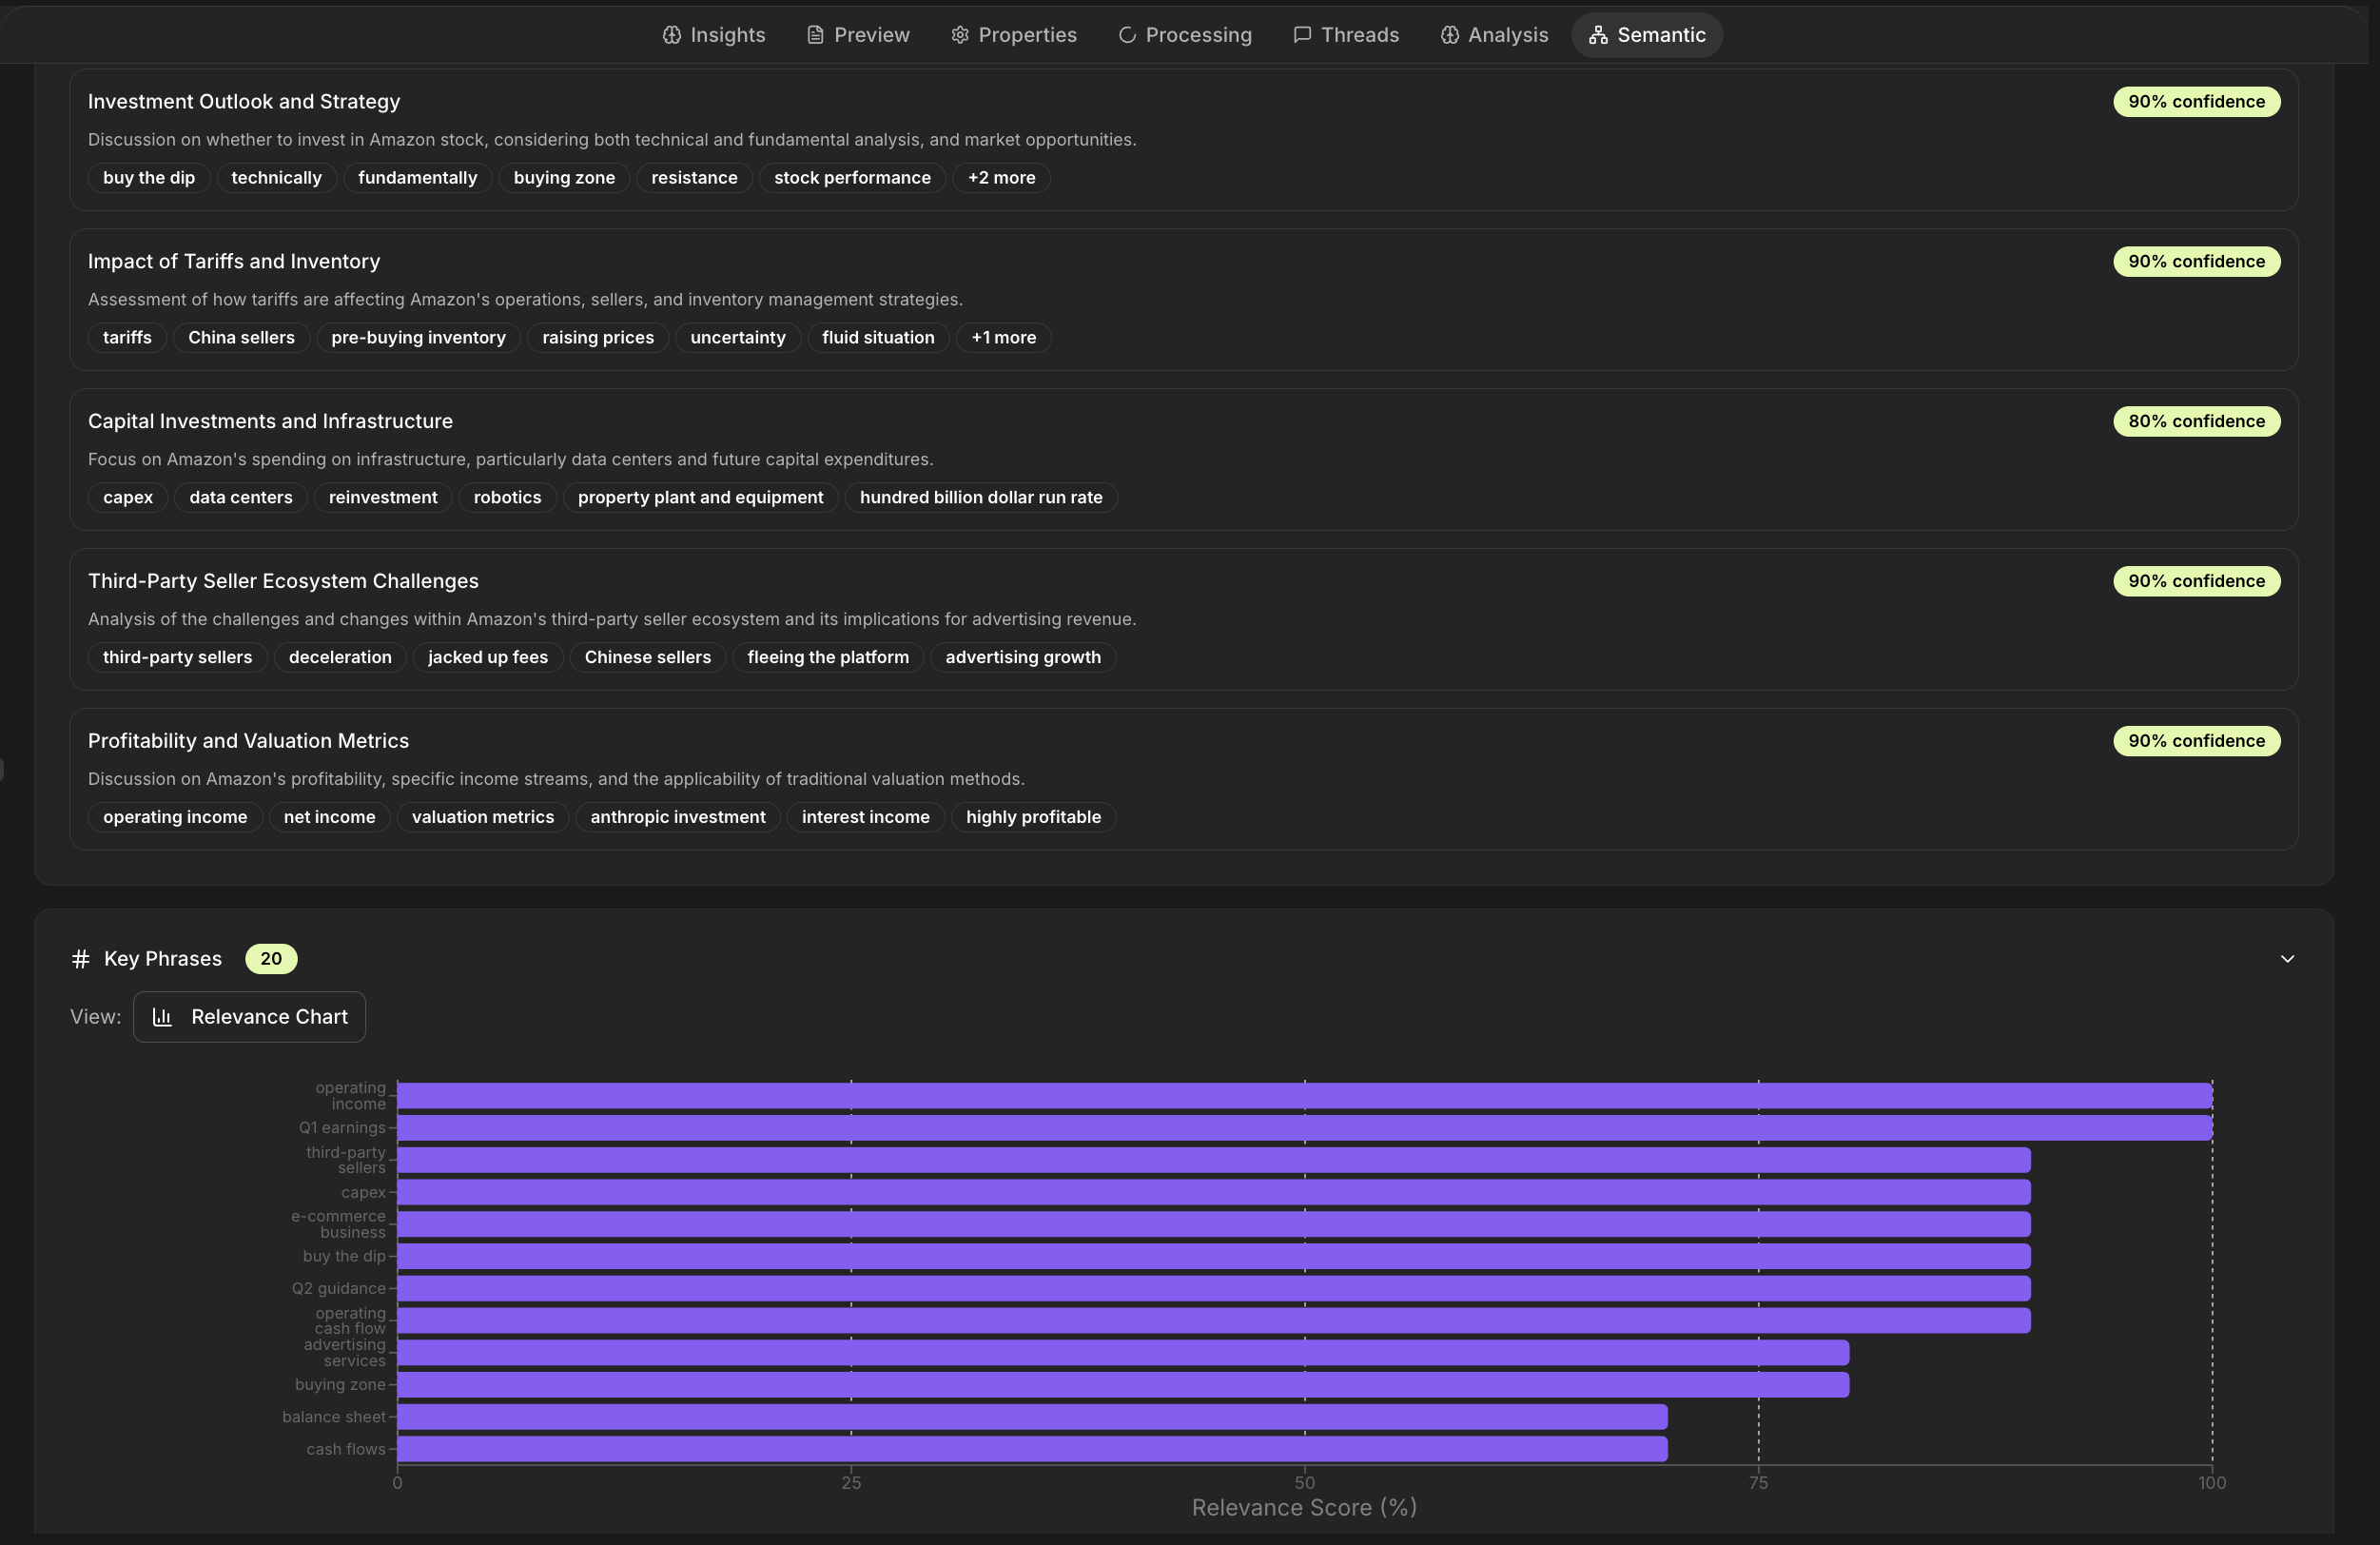
| Key phrases (relevance-scored) | 20 |
| Domain terms (finance/e-commerce) | 15 |
| Relationship Metrics | Value |
|---|
| Semantic edges mapped | 847 |
| Causal chains identified | 23 |
| High-confidence prediction signals | 6 |
| Entity disambiguation accuracy | ~92% |
Architectural Principle: Treat every extraction as a first-class primitive (node/edge) with provenance and confidence. If it can't be queried, it's not intelligence.
From video to vectors — Helix automatically parses transcripts, metrics, and metadata into structured entities.
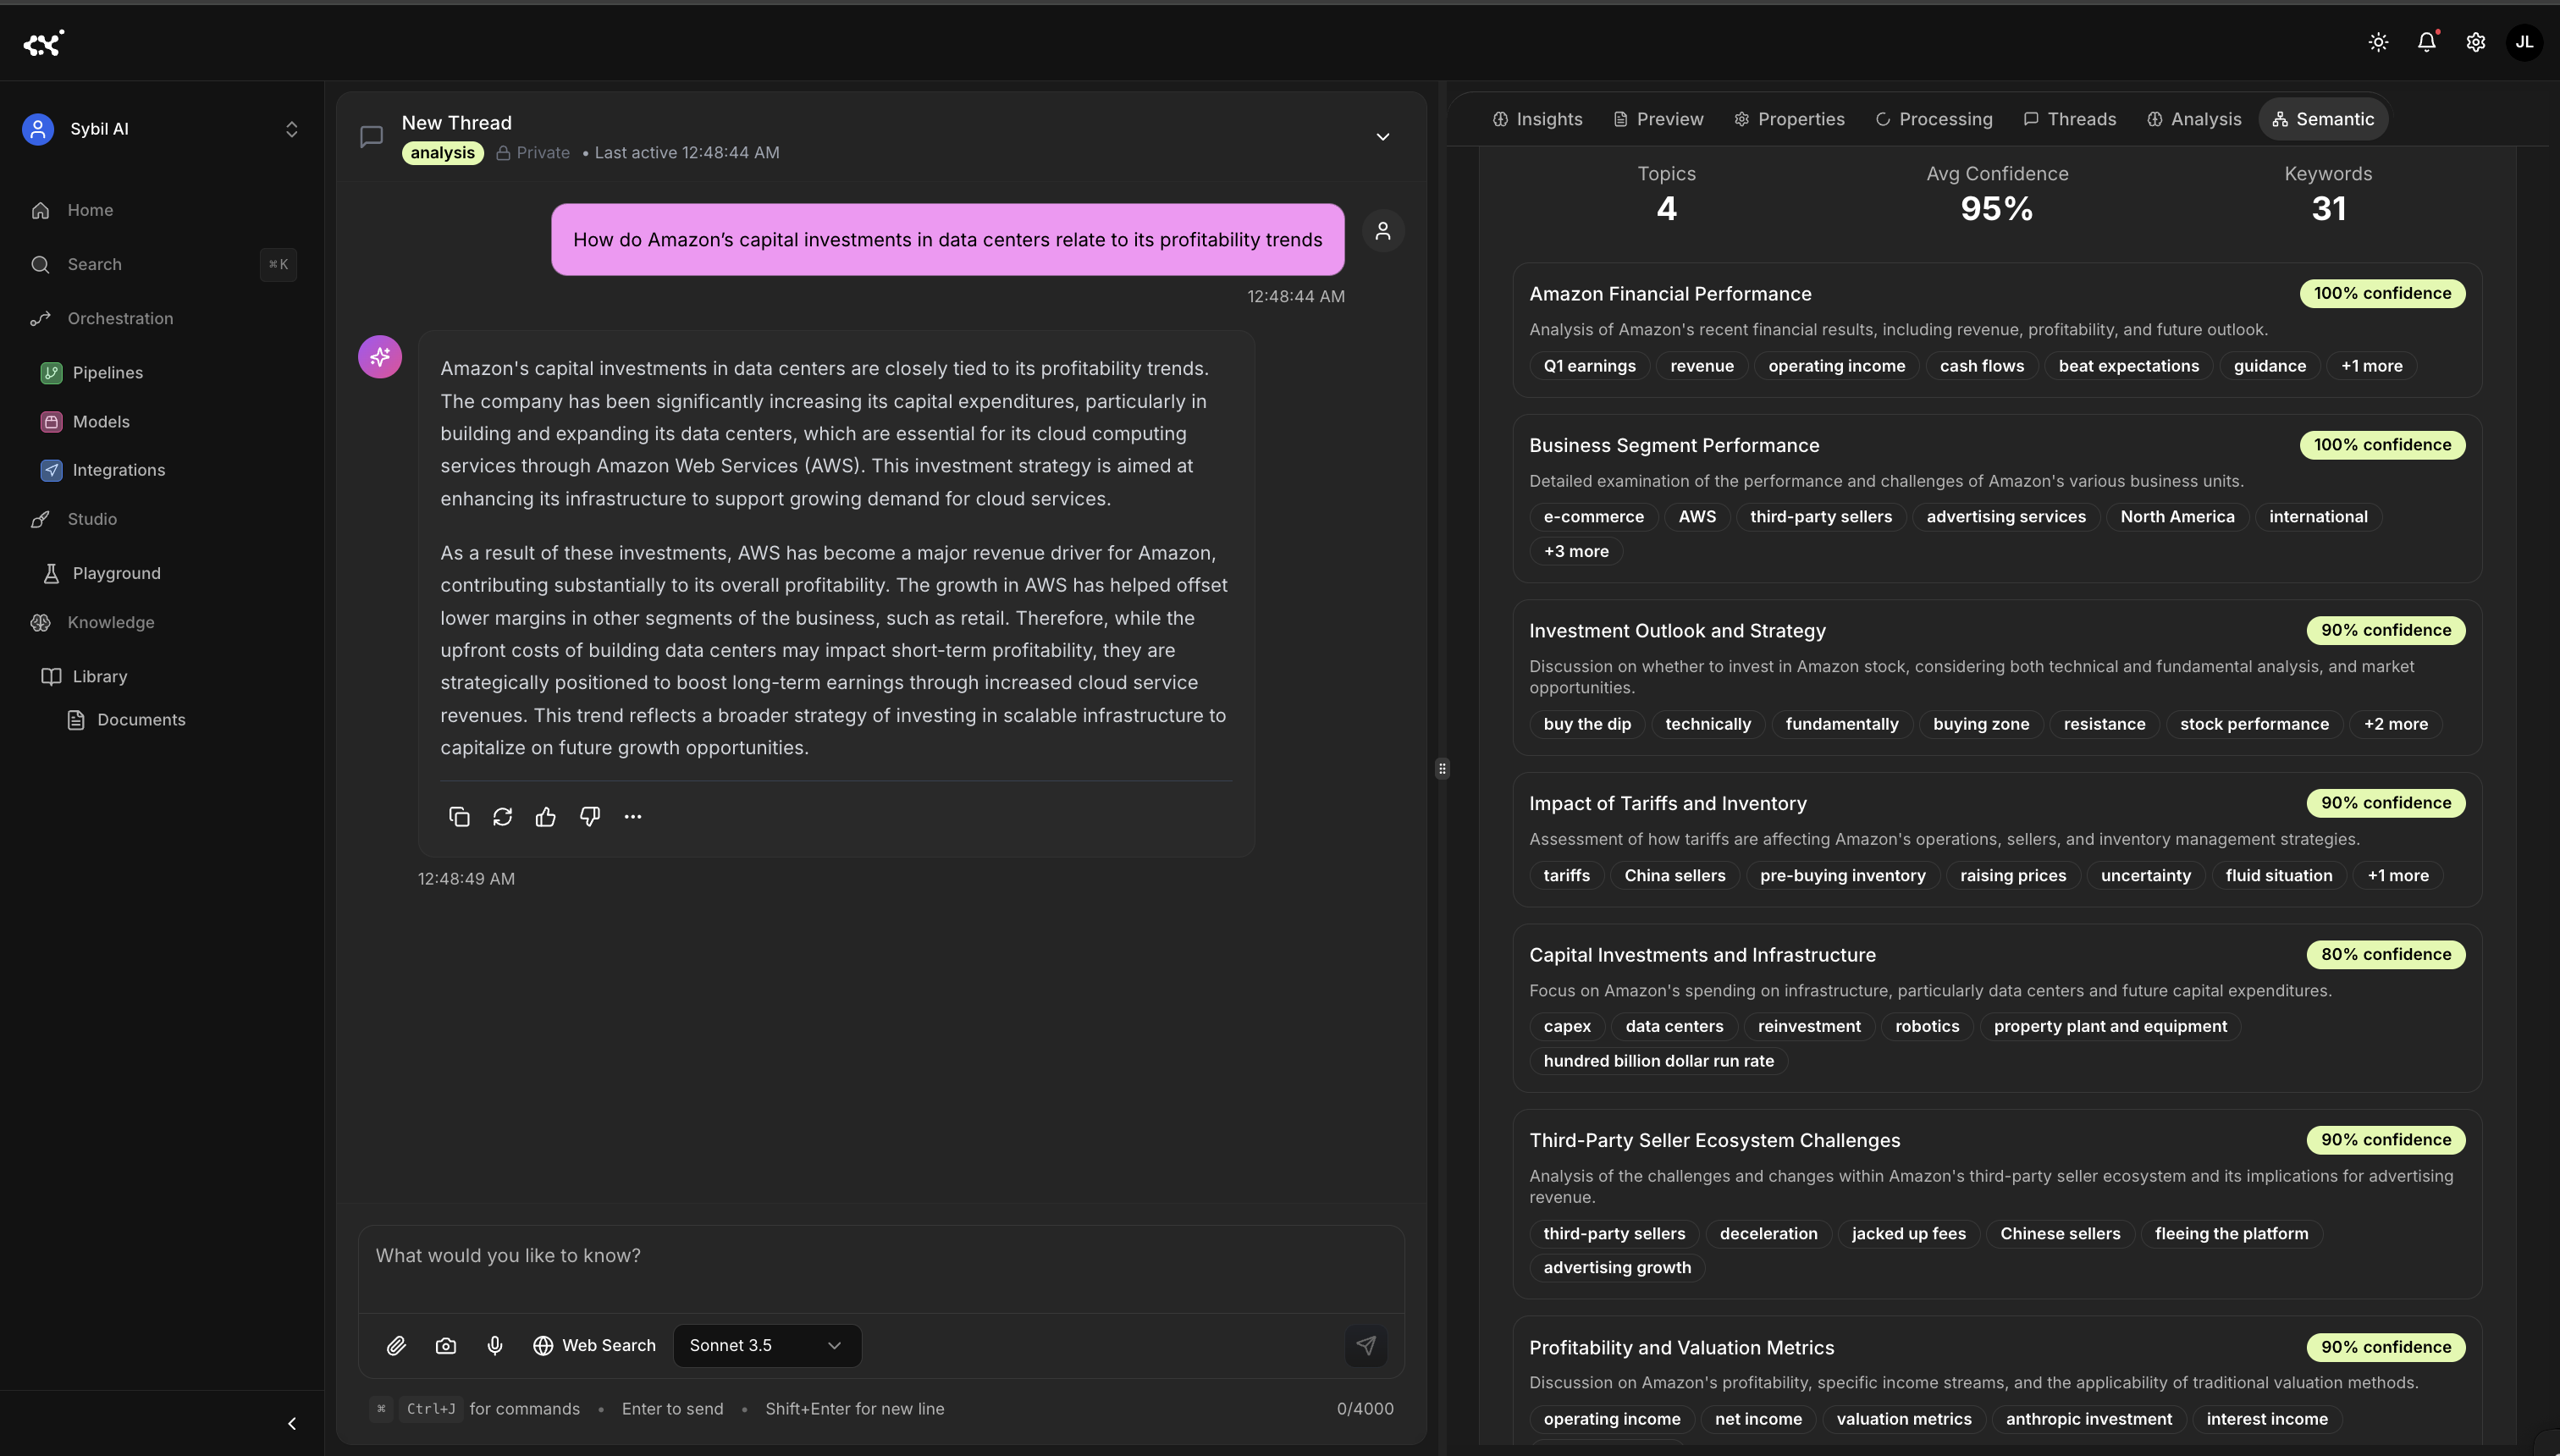
The Semantic Understanding layer classifies discussions into major themes such as CapEx, tariffs, valuation, and profitability — forming the foundation of contextual analytics.
How RTL Turns Talk Into Structure
We don't ETL media; we RTL it—reason over content, transform to knowledge, load into graphs.
From there, RTL takes over — reasoning, transforming, and loading meaning into a graph.
| Component | Description | Output |
|---|
| YouTube Loader | Metadata + transcript + channel context | JSON + video_id |
| STT Adapter | Cleaned, timestamped segments | 9:31 aligned transcript |
| Semantic Extraction | Ensemble NER + topics + phrases | 14 entities, 7 topics, 20 phrases |
| Graph Builder | Edges + causal chains + weights | Interactive reasoning graph |
| Confidence Model | Probabilistic scoring | Around 90–95% avg. confidence |
| Viz/Export | Panels + Neo4j/Cypher/JSON-LD | Graph view + APIs |
Extraction Layers
Named Entities
The model ensemble identifies organizations, segments, locations, and events with finance-specific tuning.
- Organizations: Amazon, AWS, Google Cloud, Snap, Wall Street
- Products/Segments: Prime Services, Advertising, Google Cloud
- Locations: North America, China, International
- Events: Q1 earnings, call, holiday season
Topic Discovery
Finance embeddings surface latent structure and thematic clusters.
- Capital Investments: data centers, infra spend
- Profitability Trajectory: margin recovery, op income
- Tariffs: supply chain, pricing pressure
- Third-Party Sellers: ecosystem → monetization
Causal Relationship Extraction
The model ensemble infers directional and causal weight between entities.
Third-Party Sellers → Advertising Revenue
Advertising Revenue → Operating Income
Data Center Investment → AWS Margin Expansion
Tariffs → Inventory Pre-buying → Cash-flow Timing
Architectural Principle: Confidence isn't a footnote—it's a governance surface. Persist per-node and per-edge confidence for audit and policy.
Automated extraction of entity relationships and key insights from the transcript, including confidence metrics and knowledge graph inputs.
Seeing the Reasoning
Turning nine minutes of market talk into a visual map of cause and effect
Analysts don't think in keywords. They reason in clusters and chains.
Once relationships are mapped, the graph becomes a mirror of reasoning — not just what was said, but how ideas connect.
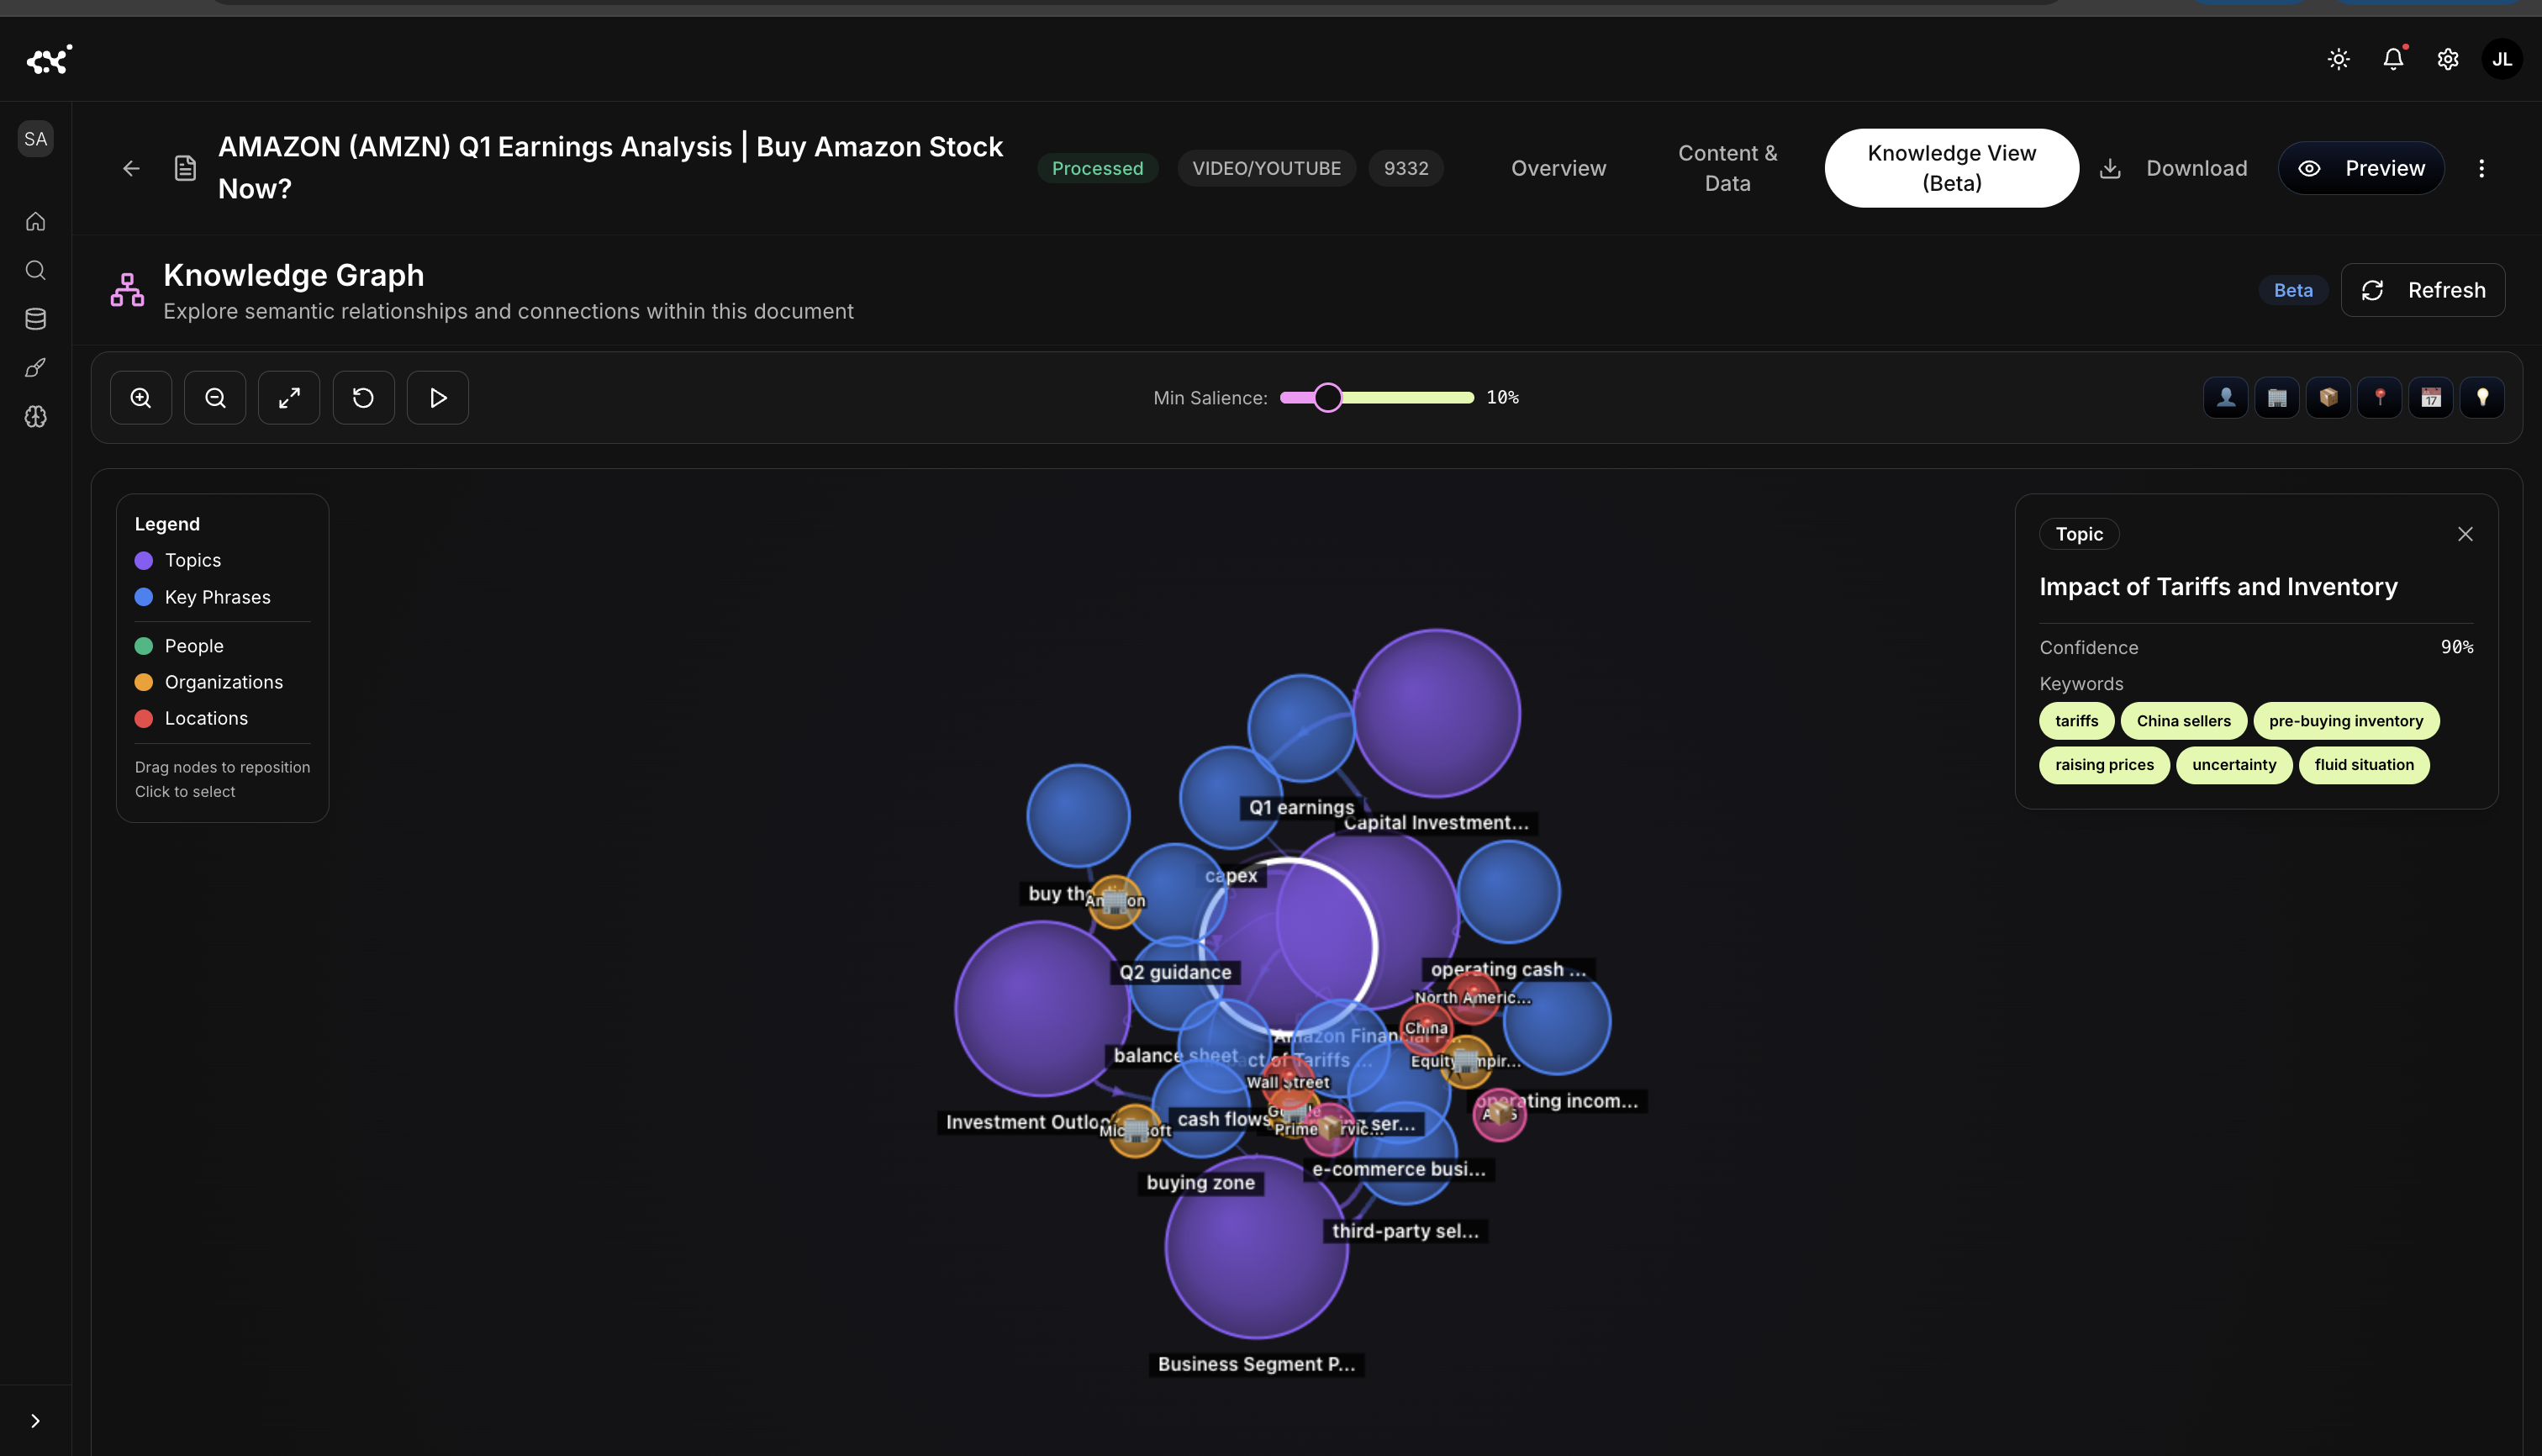
Knowledge graph visualization of semantic relationships among key entities and topics — CapEx, tariffs, guidance, and cash flow form the analytical network core.
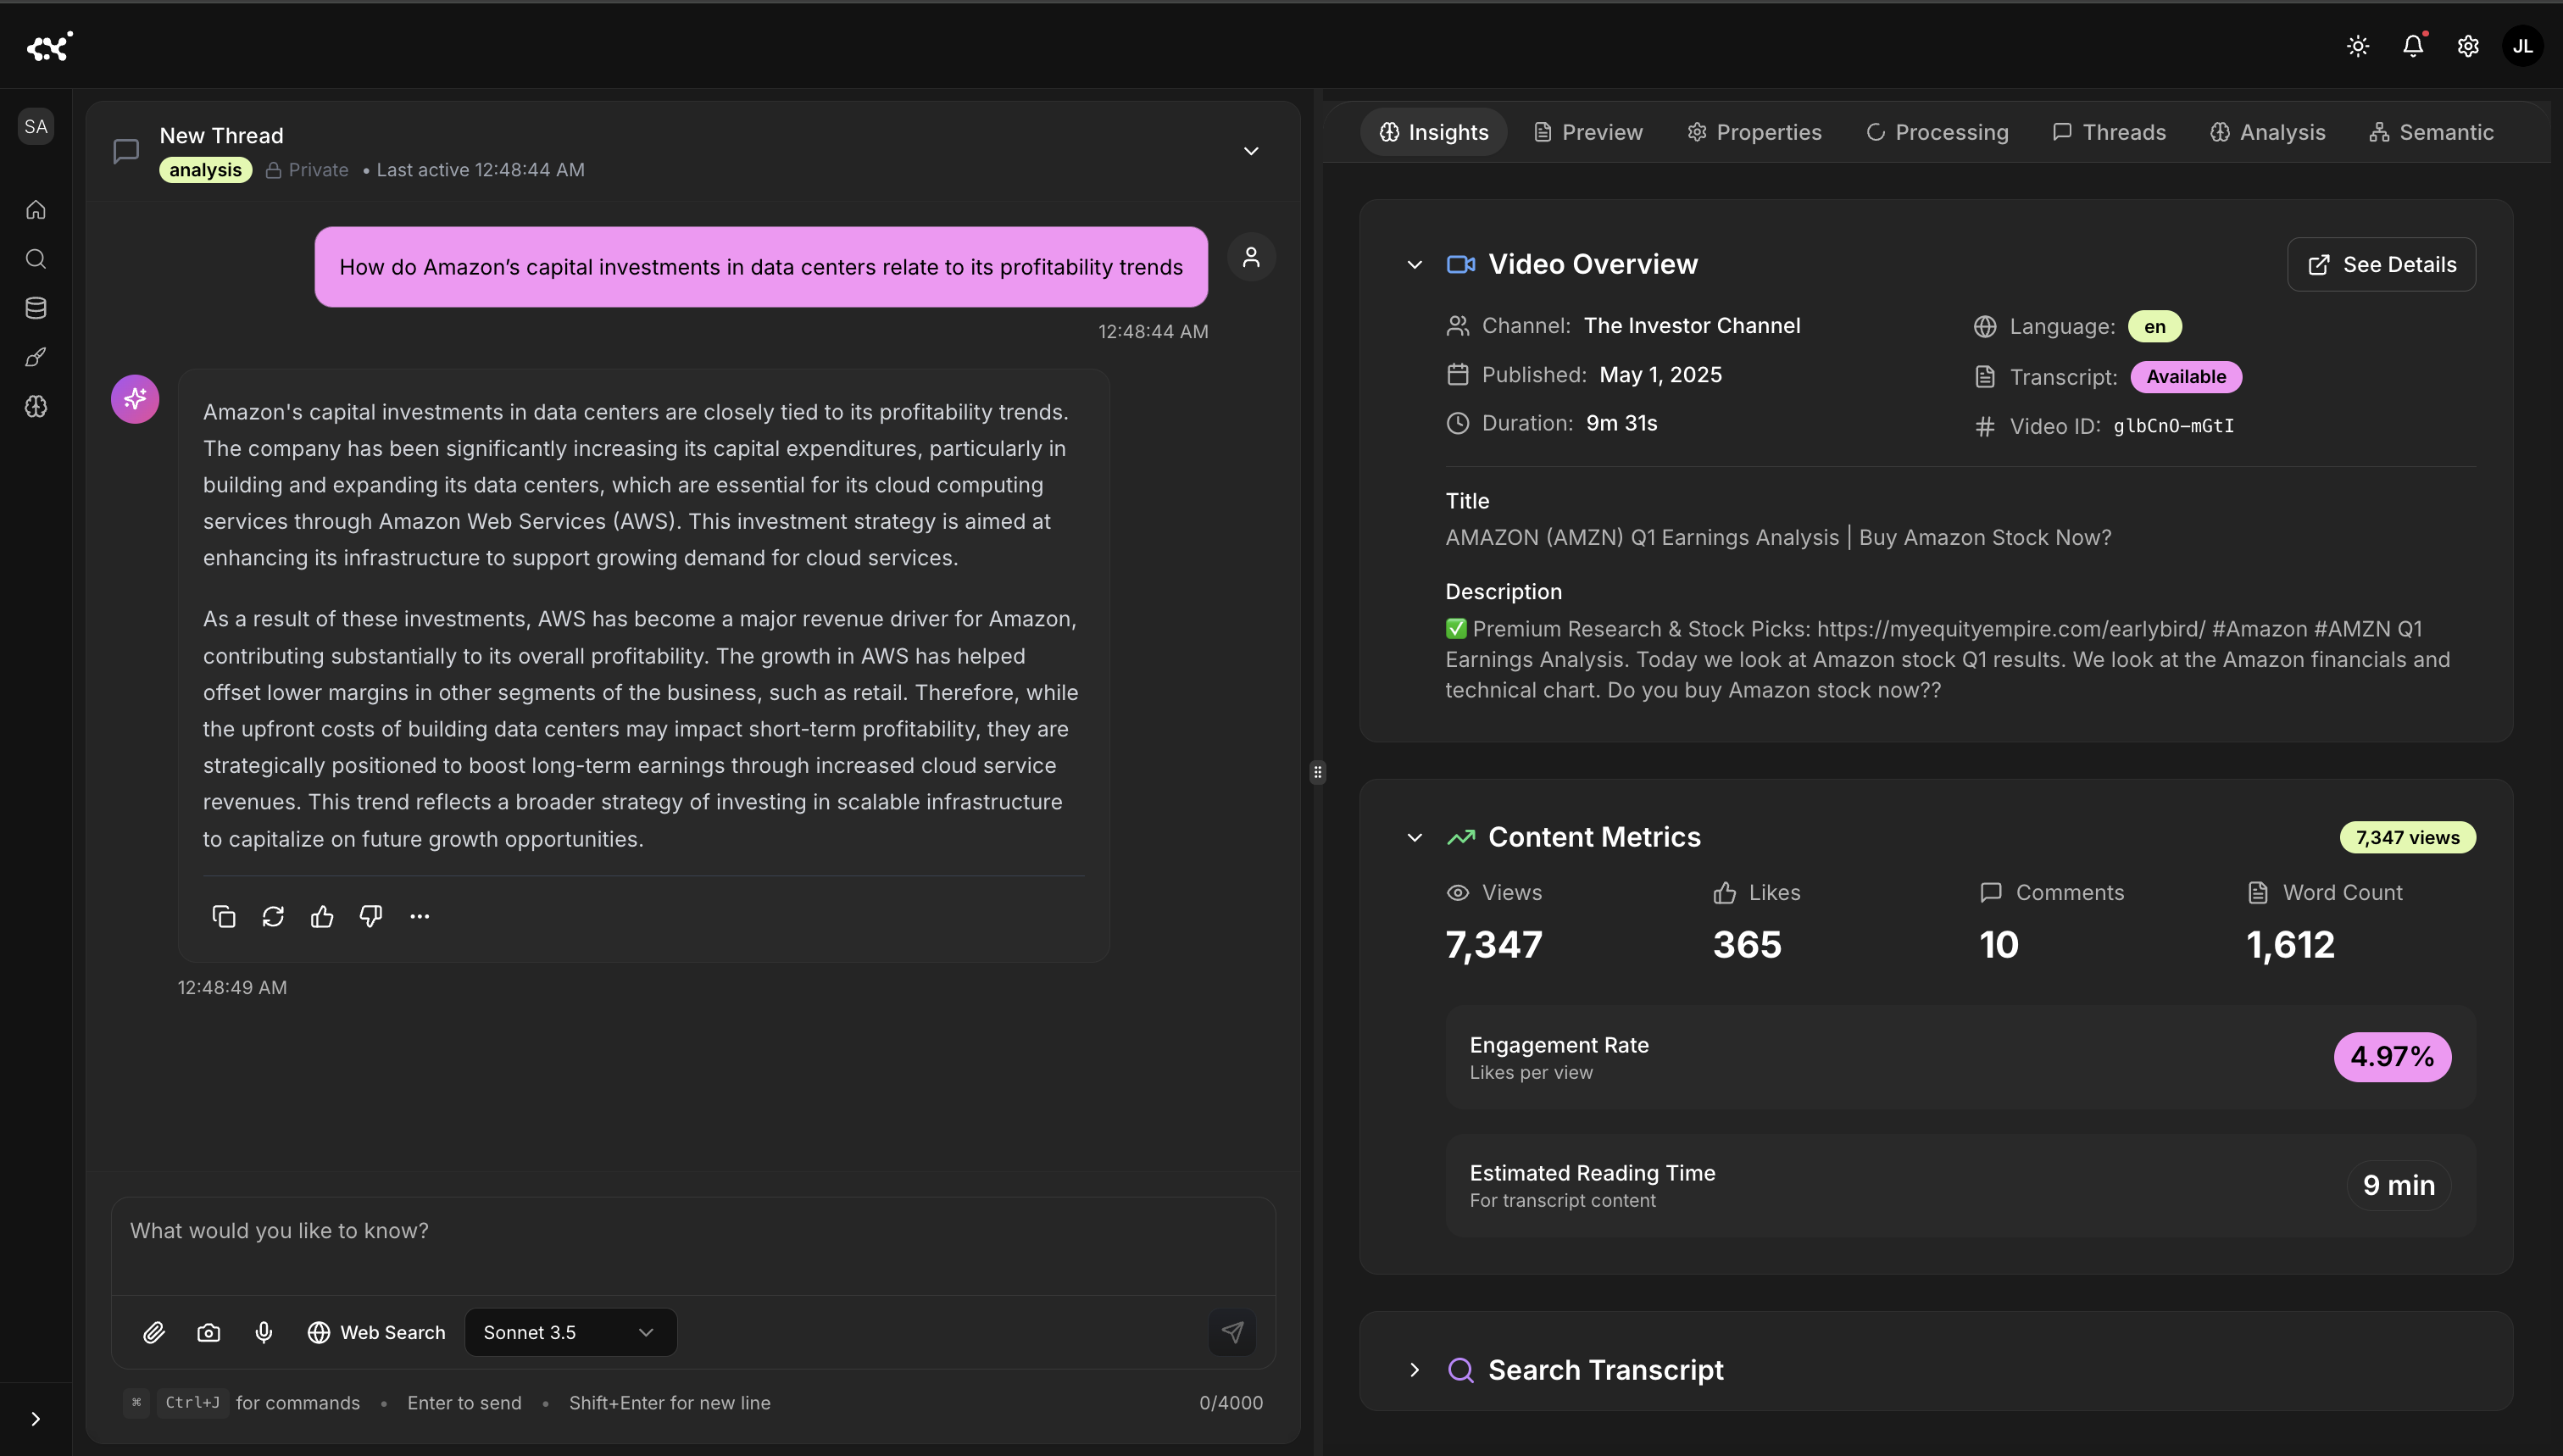
Explanatory reasoning generated from the graph: How do Amazon's capital investments in data centers relate to profitability trends? The system synthesizes semantic evidence into a narrative answer.
The output isn't a static summary. It's an explanatory layer — a living reasoning graph capable of answering questions with traceable evidence.
Example Chain:
Third-Party Sellers → Advertising Revenue → Operating Income
This chain captures Amazon's margin recovery logic: marketplace growth drives ads, which expands operating income even if retail margins lag.
Architectural Principle: Promote "center chains" (highest cumulative edge weight) to first-class insights. They are your narrative spine.
Querying Reasoning, Not Mentions
Keywords report mentions; topics encode causal context.
Traditional search: "cash flow" AND "inventory" → three fragments
Semantic query (Cypher):
MATCH (risk:Topic)-[:IMPACTS]->(m:Entity {type:"Financial"})
WHERE risk.confidence > 0.85 AND m.name IN ["cash_flow","margins","guidance"]
RETURN risk.description, m.impact_magnitude, m.temporal_context
ORDER BY risk.confidence DESC
Output (condensed): Inventory pre-buying → short-term cash flow compression (Q2 window), 90% confidence; linked to China suppliers + tariff policy.
Architectural Principle: Expose graph queries as product features (saved queries, alerts, policies). Reasoning is an interface.
What Teams Are Doing With It Now
Earnings Briefs — Two-page exec brief in ~12s; 7 topics, 14 metrics, 3 risk signals, 5 strategic shifts.
Compliance Tagging — Auto-flag forward-looking statements; surface safe-harbor needs; lineage preserved.
Competitive Intelligence — Cross-company narrative diffs (CapEx, AI, margins) in minutes.
Trading Features — Semantic deltas → quant signals (guidance surprise, CapEx concern, AWS margin path).
Architectural Principle: One graph, many workloads. Keep it composable: briefs, rules, signals, agents—same substrate.
Under the Hood: What the Engine Saw
Entities by Category
| Category | Count | Examples | Avg. Confidence |
|---|
| Organizations | 6 | Amazon, AWS, Google, Microsoft, Snap, Wall Street | 94% |
| Products/Segments | 2 | AWS, Prime Services | 96% |
| Locations | 3 | North America, China, International | 91% |
| Events | 3 | Q1 Earnings, Call, Holidays | 89% |
Discovered Topics
| Topic | Confidence | Indicators |
|---|
| Financial Performance Trajectory | 92% | Op income, revenue trend, margins |
| Capital Investment Strategy | 90% | Data centers, infra spend |
| Tariff & Inventory Impact | 88% | China suppliers, pre-buying |
| Third-Party Seller Dynamics | 91% | Marketplace to ads |
| AWS Profitability Path | 93% | Margin expansion, enterprise |
| Market Outlook & Guidance | 87% | Estimates, priorities |
| Competitive Positioning | 85% | Cross-company diffs |
Key Phrases (Relevance)
| Phrase | Relevance | Freq | Context |
|---|
| operating income | 95% | 8x | Profitability, margin recovery |
| third-party sellers | 92% | 6x | Marketplace dynamics |
| pre-buying inventory | 89% | 4x | Tariff mitigation |
| cash flows | 87% | 5x | Working capital timing |
| data center investment | 91% | 7x | CapEx, infra buildout |
Domain Terms
| Term | Domain | Context |
|---|
| CapEx | Finance | Long-term asset investment |
| Operating Margin | Finance | Op income / revenue |
| Guidance | Finance | Forward estimates |
| Buybacks | Finance | Repurchase programs |
| Working Capital | Finance | Current A - current L |
| Take Rate | E-commerce | % of GMV retained |
| Cloud Migration | Technology | On-prem to cloud |
Architectural Principle: Persist panels + raw graph under one ID. Panels are views; the graph is the source of truth.
Why RTL Changes the Game
If 2010s was "data is oil," the 2030s is reasoning as electricity. Files aren't endpoints; they're reasoning artifacts. RTL is the pattern that operationalizes that reality.
| Yesterday: Storage | Today: Retrieval | Tomorrow: Reasoning |
|---|
| Files, buckets | Vectors/RAG | Knowledge graphs |
| Full-text search | Better recall | Causal networks |
| Manual reads | Limited reasoning | Agents |
| Siloed insight | | Continuous intelligence |
Architectural Principle: The intelligence flywheel starts with one asset. Ingest → Enrich → Automate → Learn—loop over the same graph.
Closing: From Analysis to Understanding
Nine minutes of talk became a living map of how Amazon thinks.
Not a transcript.
Not a summary.
A structured model of cause and effect — ready to query, compare, and build on.
That's the difference between content and cognition.
Reasoning is no longer a human-only skill. It is now a system capability — observable, verifiable, and composable.
The companies that learn to capture how they think — not just what they said — will own the next decade of decision infrastructure.
The intelligence layer doesn't just parse—it learns how we reason with information.
Every company runs on reasoning. Helix makes it visible.
Author: James Labastida — Founder & CEO, Helix AI
Building the reasoning layer for enterprise intelligence.